
Demographic Collection
"Exploring the Historical Demographic Landscape


For sale as Licensed Images
Choose your image, Select your licence and Download the media
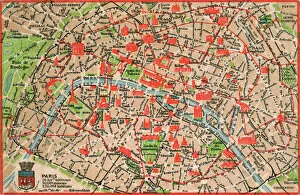
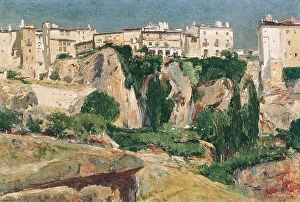
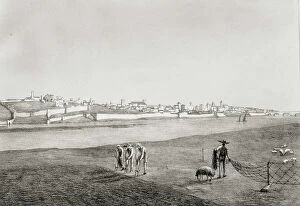
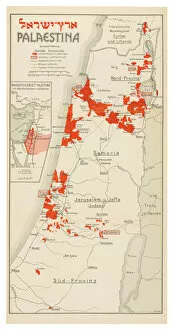
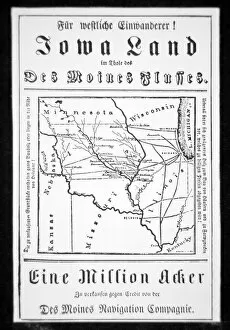
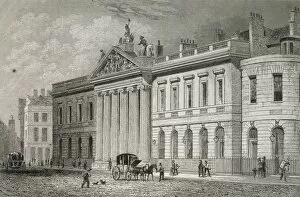
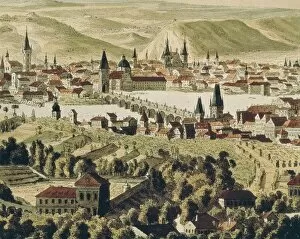
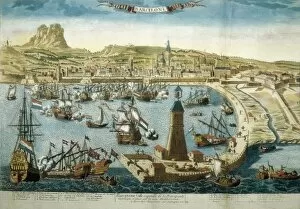
"Exploring the Historical Demographic Landscape: Tracing Identities and Migrations" Step back in time with this captivating collection of historical artifacts that offer a glimpse into the demographic tapestry of various regions. Starting with a map of Paris in 1908, we uncover geographic and demographical data that reveals how populations were distributed across the city during that era. Moving on to Spain, we delve into Sitges during the Spanish Civil War (1936-1939). Through thought-provoking visuals, we witness the impact of war on demographics and communities as they navigate through challenging times. Shifting our focus to America, an intriguing graph showcases the foreign-born population in 1920. This lithograph provides insights into immigration patterns and highlights how diverse cultures contributed to shaping American society at that time. Next, we explore Ireland's native distribution density and their proportion within the overall population. With vivid colors illustrating this phenomenon from an atlas dating back to 1848, it offers a fascinating perspective on regional demographics. Traveling further eastward, a colorful lithograph presents Palestine in 1926. This visual feast not only displays its geographical features but also sheds light on its diverse demographic makeup during that period. Venturing across continents, we encounter a German broadside published by Des Moines Navigation Company aimed at attracting immigrants. It serves as a testament to how different countries actively sought individuals from various backgrounds for economic growth or cultural enrichment. In England's bustling capital city during the 19th century, London's India Company left an indelible mark. An engraving captures their influence while showcasing demographic interactions between British colonizers and Indian communities residing there. Zooming closer to home again is Vilanova i Piera's agronomic map created by Joan Vilanova i Piera himself (1821-1893). This masterpiece illustrates land usage patterns influenced by agricultural practices intertwined with local demographics. Further south lies Peru's vibrant capital Lima, immortalized in an engraving.