
Electrocardiogram Collection
"Capturing the Rhythm of Life: Exploring the World of Electrocardiogram" Witnessing the beauty within


For sale as Licensed Images
Choose your image, Select your licence and Download the media
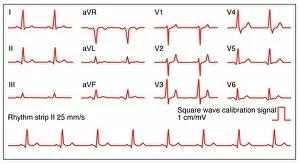
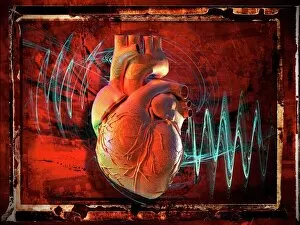
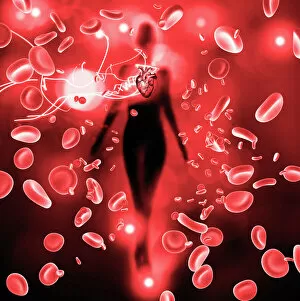
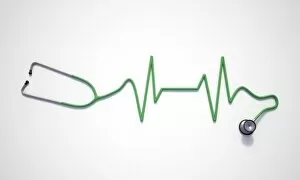
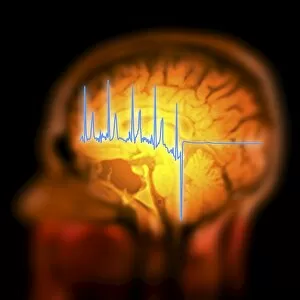
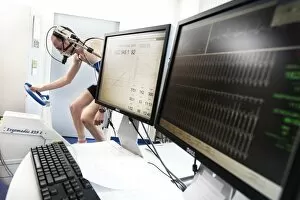
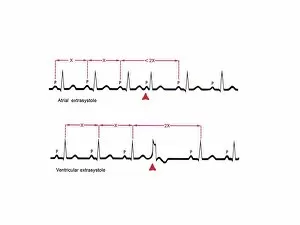
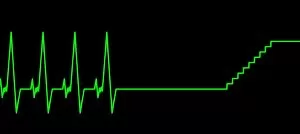
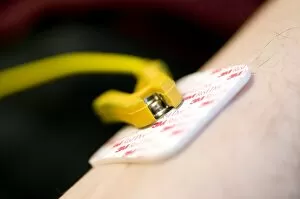
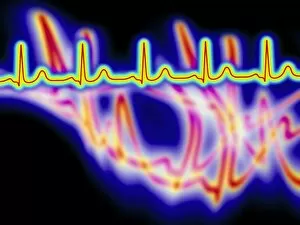
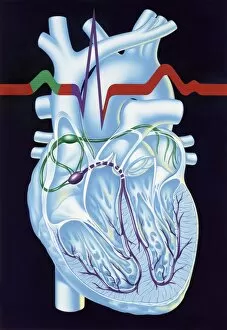
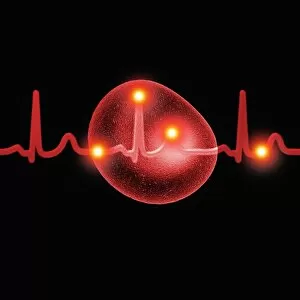
"Capturing the Rhythm of Life: Exploring the World of Electrocardiogram" Witnessing the beauty within, ECGs unveil the symphony of a normal heart rate through intricate artwork. Unveiling secrets, irregular heartbeat patterns emerge as captivating brushstrokes on an ECG canvas. A masterpiece in motion, human hearts become living art when their beats are translated into mesmerizing ECG tracings. The vital dance between red blood cells and our beating hearts comes alive in stunning depictions on an ECG printout. Delicate lines intertwine to form an electrocardiogram, capturing the essence of our pulsating life force. Peering into our core, ECGs provide a window into the complex workings of the human heart like no other medium can offer. Tracing danger's path, an ECG becomes a lifeline during a heart attack, guiding doctors with its telltale signs on paper. In close-up detail, an ECG monitor reveals its magic as it prints out crucial information about cardiac health for further analysis and care. Conceptual artwork portrays vibrant visuals symbolizing heart health intertwined with technology in harmony - Heart Health F006 / 3776 Merging science and art seamlessly, electrifying strokes create captivating imagery that represents both life-sustaining rhythms and medical advancements - Artwork F006 / 4606 Illuminating connections between cardiovascular health and brain function through artistic renditions combining MRI scans with intricate ECG traces - Artwork merging F006 / 4606 An artistic fusion captures both physicality and intellectuality by blending detailed head illustrations with mesmerizing electrocardiogram tracings.