
Gene Expression Collection (page 2)
"Unveiling the Secrets of Gene Expression: From Electrophoresis to Microscopic Views" Gene expression, a fundamental process in biology


For sale as Licensed Images
Choose your image, Select your licence and Download the media
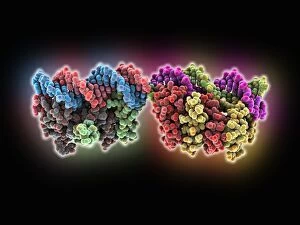
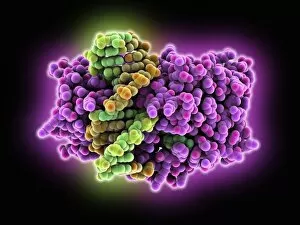
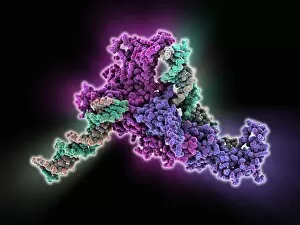
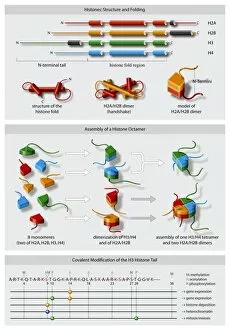
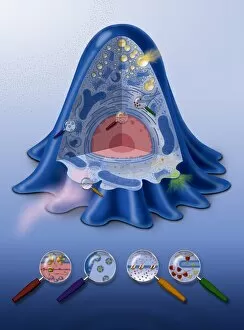
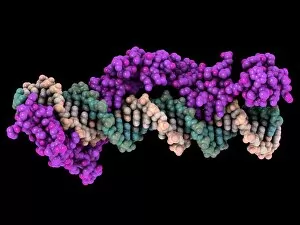
"Unveiling the Secrets of Gene Expression: From Electrophoresis to Microscopic Views" Gene expression, a fundamental process in biology, holds the key to understanding how our genetic information is utilized by cells. Through various techniques and observations, scientists have been able to delve deeper into this intricate mechanism. Electrophoresis of RNA allows researchers to separate and analyze different types of RNA molecules based on their size and charge. This technique provides valuable insights into gene expression patterns within cells and helps unravel the complex network of interactions between genes. Microscopic views offer glimpses into the fascinating world inside developing organisms. One such view captures a blastula during pregnancy, showcasing the early stages of embryonic development where gene expression plays a crucial role in shaping an organism's future. Stochastic gene expression adds another layer to our understanding. Illustrated as C018 / 0906, it highlights the random nature through which genes are activated or repressed within individual cells. This stochasticity contributes to cellular diversity and can influence various biological processes. DNA transcription, illustrated as C018 / 0900, represents one of the central steps in gene expression. It involves converting DNA sequences into messenger RNA (mRNA), which serves as a template for protein synthesis – an essential aspect for cell function. GAL4p activator proteins (C017 / 7009 & C017 / 7008) act as master regulators that control specific genes' activation or repression. These proteins play pivotal roles in studying gene expression regulation mechanisms and uncovering new therapeutic targets for diseases like cancer. The Glycine riboswitch molecule (F007 / 9921 & F007 / 9906) showcases how certain molecules can directly interact with mRNA structures, influencing whether specific genes are expressed or not. Understanding these regulatory elements expands our knowledge about fine-tuning gene activity within cells. Genetics research (F008 / 3192) encompasses diverse studies aimed at unraveling the complexities of gene expression.