
Infra Red Collection (page 5)
"Unveiling the Invisible: Exploring the Wonders of Infra Red" Orion Nebula: Peering into the cosmic depths


For sale as Licensed Images
Choose your image, Select your licence and Download the media
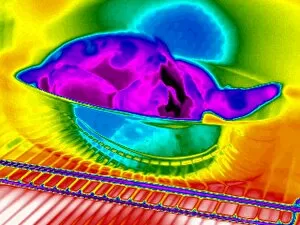
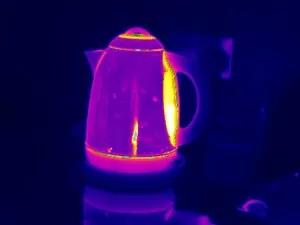
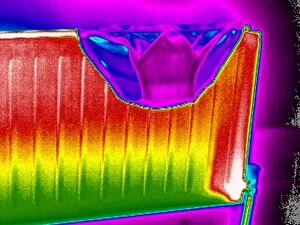
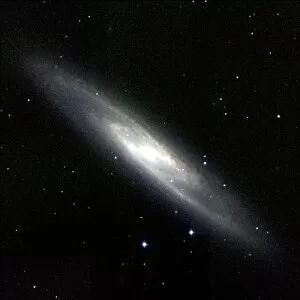
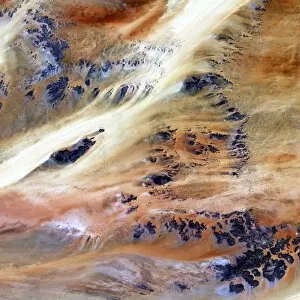
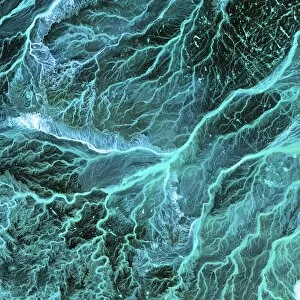
"Unveiling the Invisible: Exploring the Wonders of Infra Red" Orion Nebula: Peering into the cosmic depths, infra red reveals a breathtaking view of swirling gas and dust in the iconic Orion Nebula. Jupiter and Io, New Horizons image: With infra red vision, we witness Jupiter's enigmatic moon Io casting its shadow on the giant planet's turbulent atmosphere. HMS Dragons Lynx Helicopter Firing Flares: In an intense display of military power, infra red captures the dramatic moment when flares light up the night sky during a training exercise. Crab Nebula, composite image: Through layers of infrared data combined with other wavelengths, we unravel the intricate details within this celestial remnant - The Crab Nebula. Spiral Galaxy M81, composite image: Infra red unveils hidden secrets as it uncovers stunning spiral arms adorned with countless stars in galaxy M81. Jupiter with Moons and their Shadows: Using infra red technology to peer through Jupiter's thick clouds, we observe its moons casting ethereal shadows on its stormy surface. Cigar Galaxy (M82), composite image: Delving into deep space using infra red imaging techniques reveals a captivating view of M82 – aptly named for its elongated shape resembling a cigar. Helix Nebula, infrared Spitzer image: Witnessing stellar death in all its glory, infra red exposes mesmerizing tendrils of gas and dust forming one of nature's most beautiful sights – The Helix Nebula. Teapot and Hot Drink Thermogram: In our everyday lives too, infra-red allows us to appreciate thermal patterns as it captures a steaming hot drink pouring into a teapot - showcasing heat distribution like never before. Syrian Desert Satellite Image : From high above Earth’s surface, infra-red satellite imagery provides crucial insights into the vast expanse of the Syrian Desert, revealing hidden geological features and patterns.