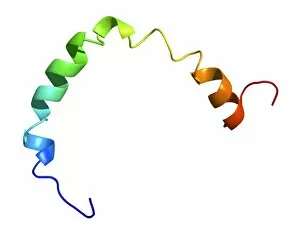
Metabolism Collection (#5)

"Unveiling the Mysteries of Metabolism

Background imageMetabolism Collection: Pancreatic alpha cell, TEM

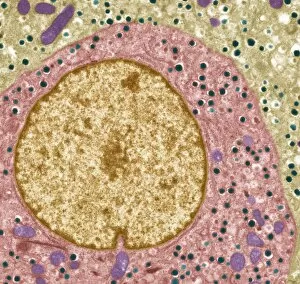
Pancreatic alpha cell, TEM
Pancreatic alpha cell. Coloured transmission electron micrograph (TEM) of a hormone-secreting (endocrine) alpha cell, found in the islets of Langerhans of the pancreas

Background imageMetabolism Collection: Thyroid follicles, artwork

Thyroid follicles, artwork
Thyroid gland. Computer artwork of a thyroid gland (red, centre), superimposed on an image of cells of thyroid follicles (green, blue)

Background imageMetabolism Collection: Cellular clock

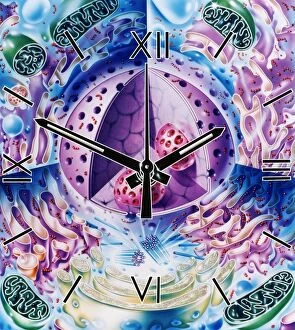
Cellular clock. Conceptual artwork of a clock and the internal structures (organelles) of an animal cell. This could represent the rate of metabolic cell reactions

Background imageMetabolism Collection: Thyroid gland, artwork

Thyroid gland, artwork. This two-lobed endocrine gland is found in the neck, in front of the trachea (windpipe, striped). The larynx (voice box, orange) sits above it

Background imageMetabolism Collection: Creation, conceptual image

Creation, conceptual image
In natural science, abiogenesis or biopoesis is the study of how biological life arises from inorganic matter through natural processes, and the method by which life on Earth arises

Background imageMetabolism Collection: Bone softening, 18th century

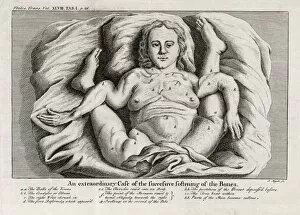
Bone softening, 18th century

Background imageMetabolism Collection: Heme group in haemoglobin, diagram

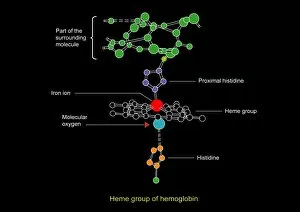
Heme group in haemoglobin, diagram
Heme group in haemoglobin. Diagram showing the heme group (centre) in the haemoglobin molecule (partly shown), the chemical unit that is responsible for the transport of oxygen in the blood

Background imageMetabolism Collection: Haemoglobin molecule, artwork

Haemoglobin molecule, artwork
Haemoglobin molecule. Computer artwork showing the molecular structure of haemoglobin, a metalloprotein that transports oxygen around the body in red blood cells

Background imageMetabolism Collection: Glycogen units, molecular model

Glycogen units, molecular model. Glycogen is made from many glucose molecules linked by one of two types of glycosidic bonds

Background imageMetabolism Collection: Glycogen phosphorylase, molecular model

Glycogen phosphorylase, molecular model. This is an enzyme involved in breaking down glycogen, the energy storage molecule involved in animal metabolism

Background imageMetabolism Collection: Myoglobin molecule

Myoglobin molecule. Computer model showing the structure of a Myoglobin molecule. Myoglobin is a protein found in muscle tissue

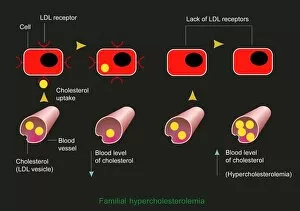
Background imageMetabolism Collection: Familial hypercholesterolaemia, diagram

Familial hypercholesterolaemia, diagram
Familial hypercholesterolaemia. Diagram showing the biochemical processes that take place in a case of the genetic disorder familial hypercholesterolaemia

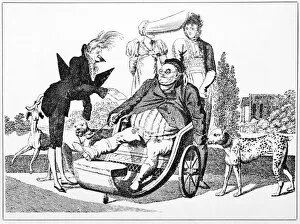
Background imageMetabolism Collection: Gout complications, satirical artwork

Gout complications, satirical artwork
Gout complications. Satirical artwork titled: The Burden of Wealth. The overweight man being wheeled around in a chair is intended to illustrate the health problems associated with wealth

Background imageMetabolism Collection: Gout and the Spider, allegorical artwork

Gout and the Spider, allegorical artwork
Gout and the Spider. Artwork illustrating the fable of Gout and the Spider, as told by the French poet and author Jean de La Fontaine (1621-1695)

Background imageMetabolism Collection: Systems biology, flow chart

Systems biology, flow chart
Systems biology. Flow chart showing various biology disciplines and how they are used in modelling living organisms. An organism (top) is studied and information obtained on its genes

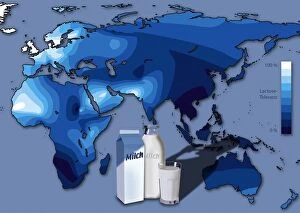
Background imageMetabolism Collection: Lactose tolerance, Eurasia and Africa

Lactose tolerance, Eurasia and Africa
GERMAN LANGUAGE VERSION. Lactose tolerance. Map of Eurasia, African and Australia, showing the varying tolerance for lactose, the milk sugar found in dairy products from cows milk (lower centre)

Background imageMetabolism Collection: Human ApolipoproteinA-1

Human ApolipoproteinA-1
Molecular model of high-density lipoprotein (HDL) known as an apolipoprotein. HDLs are proteins that bind to lipid (fat) molecules and transport them around the body

Background imageMetabolism Collection: Eurasian pygmy shrew, artwork

Eurasian pygmy shrew, artwork
Eurasian pygmy shrew (Sorex minutus), artwork. This small mammal is widespread throughout northern Eurasia. It reaches a body length of just over 5 centimetres, and a weight of only 4 grams

Background imageMetabolism Collection: Common shrew, artwork

Common shrew, artwork
Common shrew (Sorex araneus), artwork. This small mammal is widespread throughout northern Europe (except Ireland). It reaches a body length of just over 8 centimetres

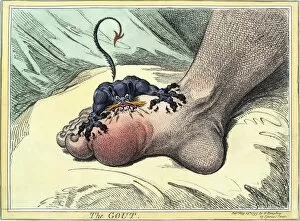
Background imageMetabolism Collection: Gout, 18th-century caricature

Gout, 18th-century caricature

Background imageMetabolism Collection: Cholesterol producing enzyme and statin

Cholesterol producing enzyme and statin. Computer model showing the molecular structure of HMG-CoA reductase (HMGCR) in complex with Atorvastatin

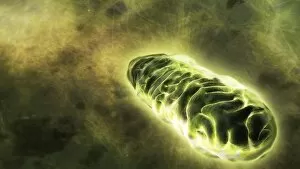
Background imageMetabolism Collection: Mitochondrial energy, conceptual image

Mitochondrial energy, conceptual image. Computer artwork of a glowing mitochondrion, representing the energy produced by these cell organelles

Background imageMetabolism Collection: Red wine and gout, artwork

Red wine and gout, artwork
Red wine and gout, conceptual computer artwork. Crystals of uric acid (yellow) amongst glasses of red wine. Gout is a condition in which uric acid crystals are deposited inside joints

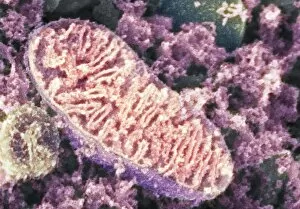
Background imageMetabolism Collection: Mitochondrion, SEM

Mitochondrion, SEM
Mitochondrion. Coloured scanning electron micrograph (SEM) of a mitochondrion in a nerve cell. Mitochondria are a type of organelle found in the cytoplasm of eukaryotic cells

Background imageMetabolism Collection: Liver, artwork

Liver, artwork. The liver is the largest gland in the human body and the largest internal organ. It plays a vital role in metabolism, storing nutrients in forms such as glycogen

Background imageMetabolism Collection: Leptin hormone molecule

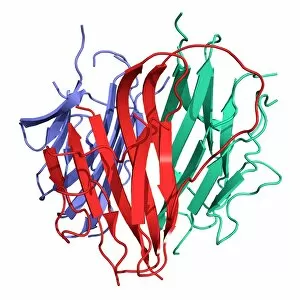
Leptin hormone molecule. Computer model showing the secondary structure of the hormone leptin. This hormone is produced by adipose (fat) tissue

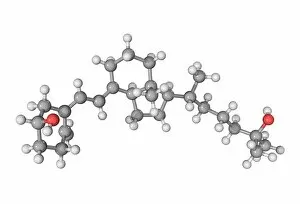
Background imageMetabolism Collection: Calcifediol molecule

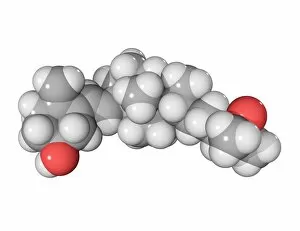
Calcifediol molecule. Computer model showing the structure of a molecule of the pre-hormone calcifediol. Atoms are colour-coded (carbon: grey, hydrogen: white)

Background imageMetabolism Collection: Adiponectin hormone molecule

Adiponectin hormone molecule. Molecular model showing the secondary structure of the human hormone adiponectin (Acrp30). Hydrogen bonding is shown by beta sheets (arrows) and random coils (wires)

Background imageMetabolism Collection: Calcitriol molecule

Calcitriol molecule. Computer model showing the structure of a molecule of the secosteroid hormone calcitriol. Atoms are colour-coded (carbon: grey, hydrogen: white, oxygen: red)

Background imageMetabolism Collection: Vitamin B12 and coenzyme molecule

Vitamin B12 and coenzyme molecule
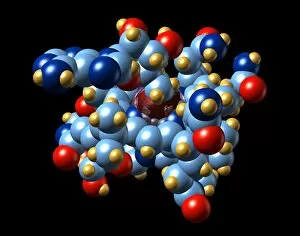
Vitamin B12 and coenzyme. Molecular model of vitamin B12 in its cofactor (active) form. Cofactors are compounds that are bound to a coenzyme

Background imageMetabolism Collection: Uric acid molecule

Uric acid molecule
Uric acid. Molecular model of uric acid, a waste compound that is produced during the digestion of purine-rich foods such as meat and fish

Background imageMetabolism Collection: Triiodothyronine hormone molecule

Triiodothyronine hormone molecule. Computer model showing the structure of the hormone triiodothyronine (T3). Atoms are colour-coded (carbon: dark grey, hydrogen: light grey, oxygen: red)

Background imageMetabolism Collection: Thyroxine hormone molecule

Thyroxine hormone molecule. Computer model showing the structure of the hormone thyroxine (T4). Atoms are colour-coded (carbon: dark grey, hydrogen: light grey, oxygen: red, nitrogen: blue)

Background imageMetabolism Collection: Cytochrome P450 molecule

Cytochrome P450 molecule
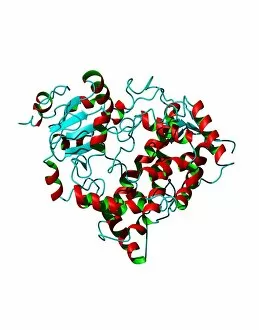
Cytochrome P450 protein. Molecular model showing the secondary structure of cytochrome P450. This protein plays a crucial role in metabolism in animals (including humans), fungi, plants and bacteria

Background imageMetabolism Collection: Myoglobin protein

Myoglobin protein
Myoglobin. Computer model of the protein myoglobin that contains the iron-containing haem group (not seen). Myoglobin consists of a chain of 153 amino acids folded into a globin molecule that has a

Background imageMetabolism Collection: Synthetic thyroid hormone molecule

Synthetic thyroid hormone molecule. Computer model of a molecule of levothyroxine (L-thyroxine, also called synthetic T4), the synthetic form of the thyroid hormone thyroxine

Background imageMetabolism Collection: Thyroid follicle structures, TEM

Thyroid follicle structures, TEM
Thyroid follicle structures. Coloured transmission electron micrograph (TEM) of a section through structures in a thyroid follicle

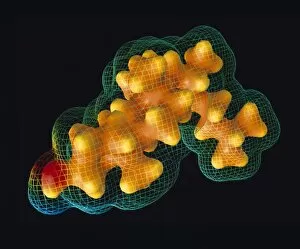
Background imageMetabolism Collection: Cholesterol

Cholesterol. Surface maps (wire-frame and colour-coded) of the electrostatic potential around a cholesterol molecule (C27. H46.O)
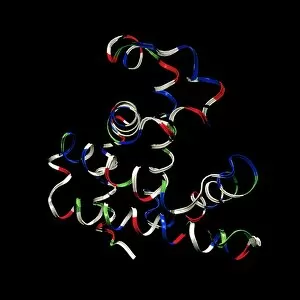
Background imageMetabolism Collection: Cytochrome P450 protein, molecular model

Cytochrome P450 protein, molecular model. This protein plays a crucial role in metabolism in animals (including humans), fungi, plants and bacteria

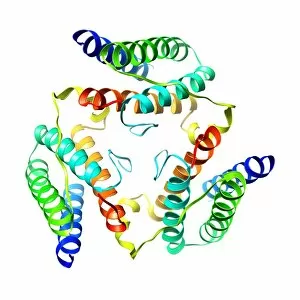
Background imageMetabolism Collection: Section of human apolipoprotein A-I

Section of human apolipoprotein A-I, molecular model. This is a fragment of a high-density lipoprotein (HDL) molecule known as an apolipoprotein


For sale as Licensed Images

Choose your image, Select your licence and Download the media

"Unveiling the Mysteries of Metabolism: Exploring the Powerhouses Within" Step into the microscopic world with TEM images revealing the intricate structure of mitochondria, the cellular powerhouses responsible for metabolism. Discover Theodor Schwann, a pioneering German physiologist whose groundbreaking work laid the foundation for our understanding of metabolism. Travel back to the 18th century when kidney stones puzzled scientists and sparked investigations into metabolic disorders. Marvel at artwork C013 / 4675 depicting thyroid anatomy, showcasing its crucial role in regulating metabolism and overall health. Delve deeper into molecular intricacies with an image of cytochrome b5 molecule C015 / 6696, unraveling its contribution to metabolic processes within cells. Witness SEM images capturing thyroid gland capillaries and blood vessels, highlighting their vital role in transporting hormones essential for metabolism regulation. Contemplate creation through a conceptual image that symbolizes how metabolism is at the core of life's energy flow. Explore mitochondria up close with SEM images that showcase their unique structures and emphasize their significance in powering cellular activities. Gain insight into human physiology with a diagram illustrating key organs involved in digestion and metabolism – liver, stomach, gallbladder, and pancreas working harmoniously together. Peer into DNA interactions as TFAM transcription factor bound to DNA C015 / 7059 reveals how genes are regulated to maintain optimal metabolic function within cells. Uncover the intricate relationship between thyroid and pituitary glands – two master regulators orchestrating hormonal balance crucial for proper metabolism control.