
Trace Collection (page 7)
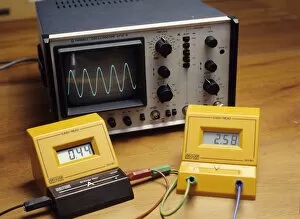
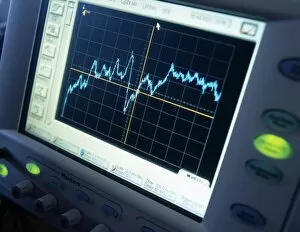
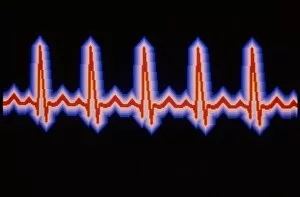
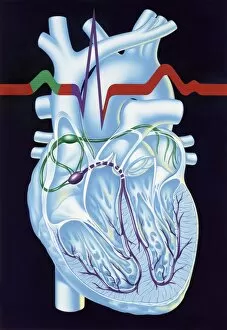
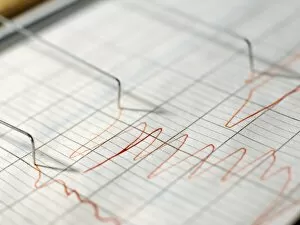
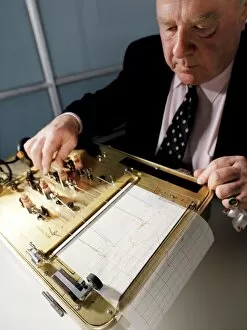
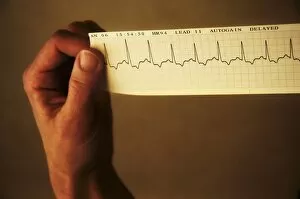
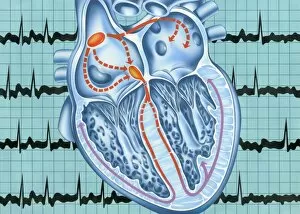
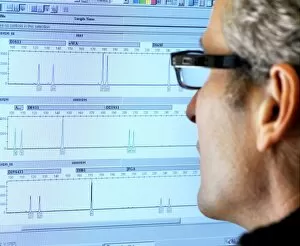
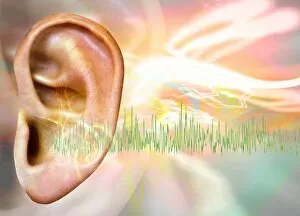
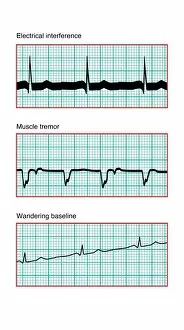
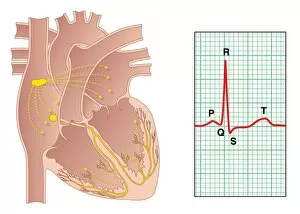
"Tracing the Unseen: From Proton Collisions to Irregular Heartbeats" In the realm of science, trace hints can unlock mysteries that lie beyond our perception


For sale as Licensed Images
Choose your image, Select your licence and Download the media
"Tracing the Unseen: From Proton Collisions to Irregular Heartbeats" In the realm of science, trace hints can unlock mysteries that lie beyond our perception. Take for instance the Proton Collision C014 in 1797, a groundbreaking event that paved the way for new discoveries. Similarly, Three Jowett Models from 1952 left a lasting trace in automotive history. But they are not limited to scientific endeavors alone; they extend into the intricate workings of our bodies. Lead ion collisions and ECGs showcasing normal heart rates offer glimpses into our innermost rhythms. Yet, sometimes an irregular heartbeat leaves behind its own unique trace, prompting us to seek answers and solutions. Artistic expressions also leave their mark on our hearts and minds. The delicate strokes of human heart artwork remind us of both vulnerability and resilience within ourselves. Meanwhile, captivating images like Armstrong Whitworth AW15 Atalanta or Flannan Isles Lighthouse etch themselves onto our memories as timeless traces of human ingenuity. Beyond these man-made creations lies nature's own tapestry waiting to be traced. A track cutting through a green field near Ermatingen in Switzerland beckons exploration amidst cultivated landscapes—a testament to harmonious coexistence between humans and nature. Whether it is delving into microscopic particles colliding or admiring grandeur crafted by human hands or Mother Nature herself, tracing hints leads us down paths filled with wonderment and understanding. These traces connect past with present, unveiling stories waiting patiently to be discovered—reminders that even the faintest hint can hold profound significance in unraveling life's enigmatic tapestry.