
Analytical Collection (page 2)
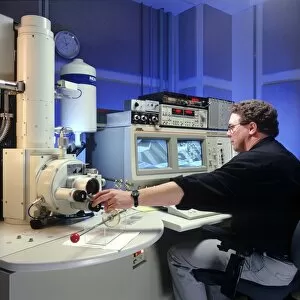
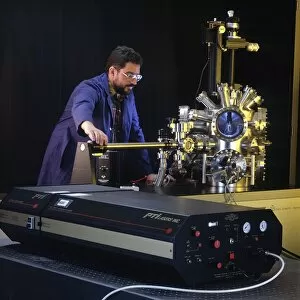
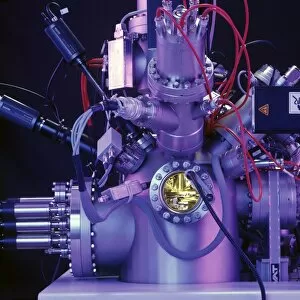
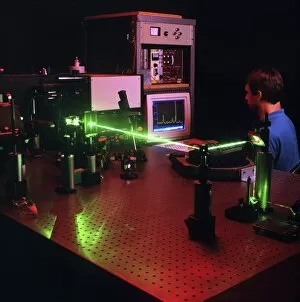
"Unveiling the Hidden World: Exploring Analytical Techniques and Visionaries" Step into the realm science, where mysteries are unraveled and secrets are revealed


For sale as Licensed Images
Choose your image, Select your licence and Download the media
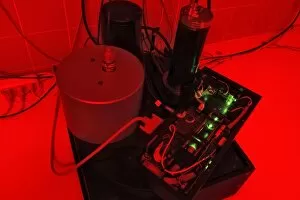
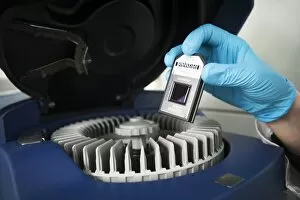
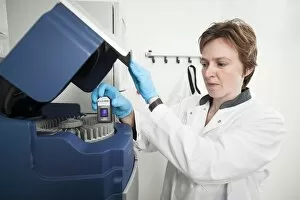
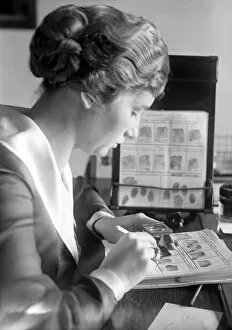
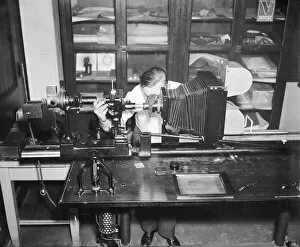
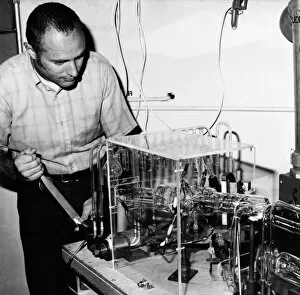
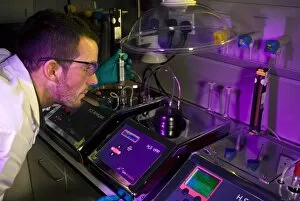
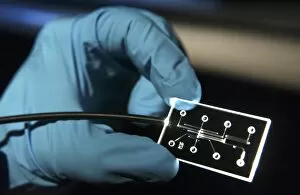
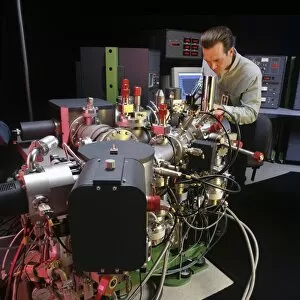
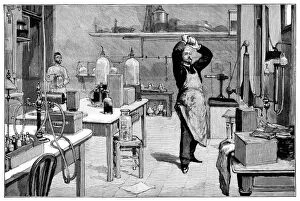
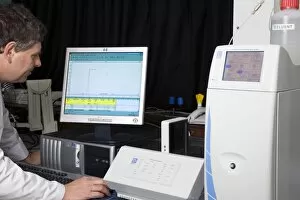
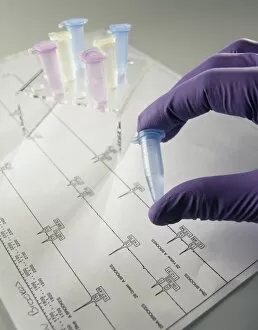
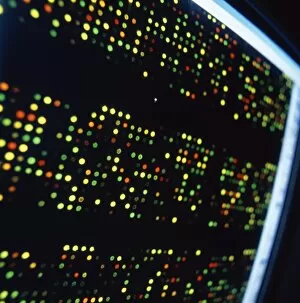
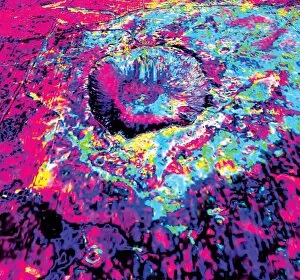
"Unveiling the Hidden World: Exploring Analytical Techniques and Visionaries" Step into the realm science, where mysteries are unraveled and secrets are revealed. In 1954, a groundbreaking invention emerged - the mass spectrometer. This marvel of technology allowed scientists to delve deep into matter, deciphering its composition with unprecedented precision. As we journey further, we encounter the mesmerizing H-He-Hg emission spectra C017 / 7260. These ethereal patterns of light unveil the unique signatures of elements, guiding us towards a deeper understanding of their properties. In this captivating exploration, we stumble upon Carl Gustav Jung - a visionary Swiss psychiatrist whose profound insights transformed psychology forever. His work delved into the depths of human consciousness, shedding light on our innermost thoughts and emotions. Electrophoresis of RNA takes center stage as we witness molecules dancing through an electric field. This technique enables scientists to separate and analyze genetic material with astonishing accuracy, unraveling intricate biological puzzles. Venturing further still, we encounter acid soil - nature's enigma that affects plant growth and agricultural productivity. Through meticulous analysis using chromatography in both 3D and 2D views, researchers unlock vital clues about soil composition and nutrient availability. Amidst these scientific wonders lies Carl Gustav Yung's enigmatic black-and-white portrait. A man who explored not only the human mind but also embraced spirituality in his quest for self-discovery. Martin Heinrich Klaproth graces our path next through an exquisite engraving; he was instrumental in discovering several chemical elements that shaped our understanding of matter itself. Achromatogram appears once again in its two-dimensional glory – a testament to its versatility as it aids scientists across various fields in unraveling complex mixtures or identifying compounds within them. Our journey concludes with "The Painters March from Finchley, " an enchanting print by Paul Sandy from 1753.