Spectrum Collection (#11)

"Spectrum: Unveiling the Colors of Science, Art, and Nature" Step into a world where science meets art and nature reveals its true colors

Background imageSpectrum Collection: High-precision spectrometer

High-precision spectrometer. Researcher using a spectrometer that has been designed to give results with high accuracy and precision. Spectrometry is the analysis of the electromagnetic spectrum

Background imageSpectrum Collection: Analysing fuel oil for silicone traces

Analysing fuel oil for silicone traces
MODEL RELEASED. Analysing fuel oil for silicone traces, using an absorption spectroscope. Metal and silicone impurities in fuel oil can lead to problems such as inefficient combustion

Background imageSpectrum Collection: Colour vision: spectrum of light entering the eye

Colour vision: spectrum of light entering the eye

Background imageSpectrum Collection: Spectrum of Pleiades

Spectrum of Pleiades
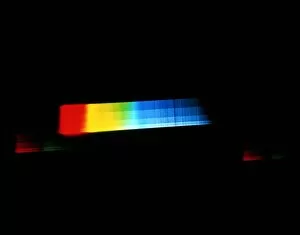
Spectrum of the Pleiades. Visible light spectrum of stars in the Pleiades open cluster. The spectrum is created by allowing light exiting a telescope to pass though a prism

Background imageSpectrum Collection: Spectrum of a star

Spectrum of a star
Spectrum of Arcturus. Visible light spectrum of the orange giant star Arcturus. The spectrum is created by allowing light exiting a telescope to pass though a prism

Background imageSpectrum Collection: Black hole spectrum, X-ray image

Black hole spectrum, X-ray image
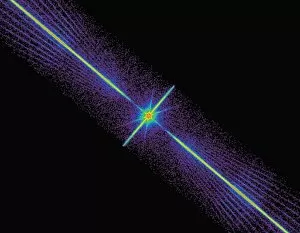
Black hole spectrum. Coloured Chandra telescope X- ray spectrum of the black hole binary system XTE J1118+480. The spectrum (narrow line)

Background imageSpectrum Collection: Optical disc

Optical disc. Compact discs (CDs) and digital versatile discs (DVDs) are examples of optical discs. An optical disc digitally stores music and other data as tiny depressions in a plastic disc

Background imageSpectrum Collection: Computer artwork of laser splitting molecule

Computer artwork of laser splitting molecule
Laser splitting molecule. Computer artwork depicting a scientific experiment in which a laser beam (red, at upper right) is used to break apart a molecule

Background imageSpectrum Collection: Hearing

Hearing
MODEL RELEASED. Hearing. Abstract depiction of human hearing, in which spectra of light are seen entering the ear of a young woman

Background imageSpectrum Collection: Digital camera displaying infrared

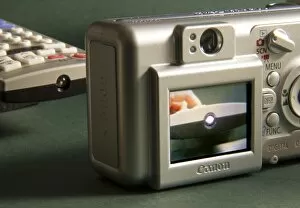
Digital camera displaying infrared. Remote control pointing at the lens of a digital camera. When the control is operated

Background imageSpectrum Collection: Dmitry Rozhdestvensky, Soviet physicist

Dmitry Rozhdestvensky, Soviet physicist
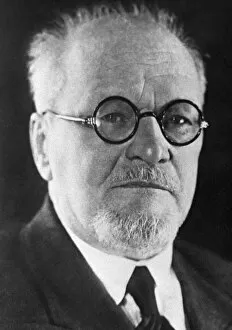
Dmitry Syergeyevich Rozhdestvensky (1876-1940), Soviet physicist and industrialist. Rozhdestvensky, a professor at the University of St Petersburg

Background imageSpectrum Collection: Anders Angstrom, Swedish physicist

Anders Angstrom, Swedish physicist
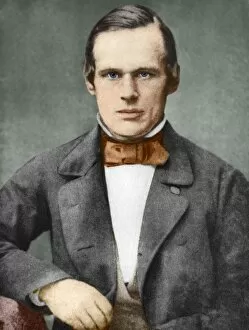
Anders Angstrom (1814-1874), Swedish physicist. Angstrom founded the science of spectroscopy, and the unit of atomic length, the angstrom, is named after him

Background imageSpectrum Collection: Prism, light spectrum

Prism, light spectrum
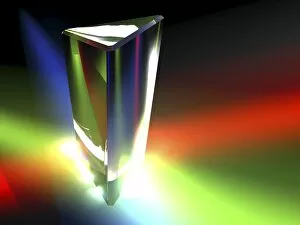
Conceptual computer artwork of a prism and light spectrum

Background imageSpectrum Collection: Rainbow over a motorway

Rainbow over a motorway

Background imageSpectrum Collection: Rainbow over a lake

Rainbow over a lake. A rainbow is seen when sunlight is refracted and reflected by raindrops in the air in front of an observer. Photographed at Surprise Lake, Atlin, British Columbia, Canada

Background imageSpectrum Collection: Rainbow and a lighthouse

Rainbow and a lighthouse. This arching spectrum of colours is seen when sunlight from behind the observer is reflected and refracted by rain in front

Background imageSpectrum Collection: Rainbow over a scots pine forest

Rainbow over a scots pine forest (Pinus sylvestris). Photographed in August, in Cairngorms National Park, Aberdeenshire, Scotland, UK

Background imageSpectrum Collection: Lunar rainbow, historical artwork

Lunar rainbow, historical artwork
Lunar rainbow. Historical artwork of a lunar rainbow, or moonbow, over a castle in Compiegne, France. A lunar rainbow is formed by the same process as a normal rainbow

Background imageSpectrum Collection: Thermogram of AC converters, artwork

Thermogram of AC converters, artwork
Conceptual computer artwork of a thermogram showing the heat loss from 2 banks of a/c power converters. Thermography detects radiation in the infrared range of the electromagnetic spectrum

Background imageSpectrum Collection: Space spectra, historical diagram

Space spectra, historical diagram
Joseph von Fraunhofer (1787-1826), a German physicist and optical instrument maker, is best known for his investigation of dark lines in the Suns spectrum. Now known as Fraunhofer lines

Background imageSpectrum Collection: Pigment spectra, historical artwork

Pigment spectra, historical artwork. Early 20th Century colour plate showing of the spectra of various pigments. Published in Quains dictionary of medicine (3rd edition), by the Irish physician

Background imageSpectrum Collection: Colour temperature spectrum

Colour temperature spectrum. This spectrum shows how the overall hue of a source of visible light can vary in terms of a calculated characteristic known as colour temperature

Background imageSpectrum Collection: Diffracted light pattern

Diffracted light pattern
Diffraction. Abstract pattern formed by diffracted light

Background imageSpectrum Collection: Early astronomical spectroscopy

Early astronomical spectroscopy
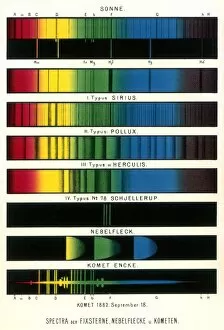
One of the earliest Illustrations of Solar and Sidereal Spectra (from an 1878 article " Chemistry of Heavenly Bodies" by Dr. J. Gladstone)

Background imageSpectrum Collection: Sandstone Mesas with Rainbow, Utah. tif C009 / 7042

Sandstone Mesas with Rainbow, Utah. tif C009 / 7042
The formation of sandstone involves two principal stages. First, a layer or layers of sand accumulates as the result of sedimentation, either from water (as in a stream, lake)

Background imageSpectrum Collection: Newtons rings effect

Newtons rings effect. Montage of several examples of the Newtons rings effect that occurs when two pieces of glass are placed together

Background imageSpectrum Collection: Mouse, infrared, computer artwork

Mouse, infrared, computer artwork
Computer artwork of a mouse depicting an infrared image of the animal like seen by some snakes. The different colours represent different temperatures

Background imageSpectrum Collection: Rainbow over fields

Rainbow over fields

Background imageSpectrum Collection: Rainbow in Devon

Rainbow in Devon
Panoramic image showing a whole rainbow near the river Taw in Devon, UK

Background imageSpectrum Collection: Earths atmosphere and radiation, artwork

Earths atmosphere and radiation, artwork
Earths atmosphere and radiation. Computer artwork showing the differing absorbance of electromagnetic waves by the Earths atmosphere

Background imageSpectrum Collection: Electromagnetic spectrum, artwork

Electromagnetic spectrum, artwork
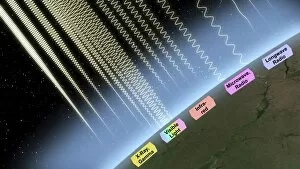
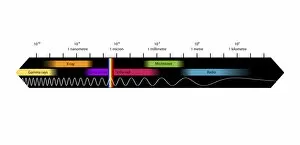
Electromagnetic spectrum, computer artwork. The changing wavelength of electromagnetic (EM) radiation through the spectrum is shown by the trace along bottom

Background imageSpectrum Collection: Coastal waterfall

Coastal waterfall, with a partial rainbow seen in the spray. The water is falling from basalt sea cliffs at Kilt Rock, on the Trotternish peninsula, on the Isle of Skye, off the coast of Scotland

Background imageSpectrum Collection: Visible light spectrum experiment

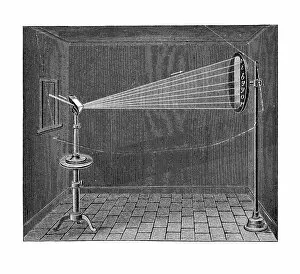
Visible light spectrum experiment. Historical artwork of the experiment that showed how a prism (upper left) can be used to split a beam of white light into its component colours

Background imageSpectrum Collection: Solar spectroscopy, 19th century

Solar spectroscopy, 19th century
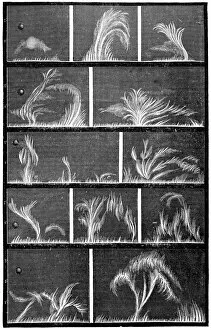
Solar spectroscopy. Artwork of solar eruptions combined with spectroscopic observations of the Sun. The depictions of the solar eruptions (prominences) and a planet (left, included for scale)

Background imageSpectrum Collection: Flame spectroscopy, 19th century

Flame spectroscopy, 19th century
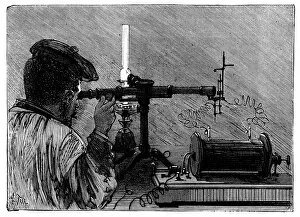
Flame spectroscopy. This apparatus uses an electric arc (battery at lower right) to burn samples to produce a flame. The colour of the flame is being analysed and compared with that from a lamp (left)

Background imageSpectrum Collection: Microwave telecommunications tower Libya

Microwave telecommunications tower Libya
Microwave telecommunications relay tower powered by an array of photovoltaic solar panels in Libya Sahara. These antennas receive, amplify and retransmit phone

Background imageSpectrum Collection: Fraunhofer lines, diagram

Fraunhofer lines, diagram
Fraunhofer lines. Diagram of the Suns spectrum, showing a set of dark absorption lines known as Fraunhofer lines. These are named after the German physicist Joseph von Fraunhofer (1787-1826)

Background imageSpectrum Collection: Rainbow over trees

Rainbow over trees

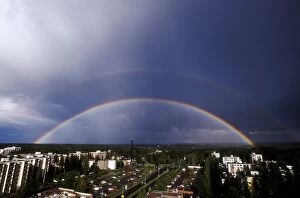
Background imageSpectrum Collection: Double rainbow over a town

Double rainbow over a town amid trees

Background imageSpectrum Collection: Rainbow over trees

Rainbow over trees

Background imageSpectrum Collection: Rainbow over a field

Rainbow over a field

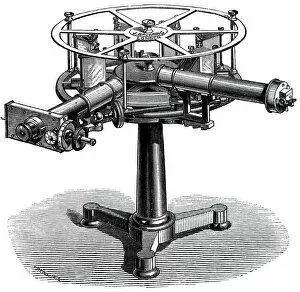
Background imageSpectrum Collection: Spectroscope, 19th century artwork

Spectroscope, 19th century artwork. Artwork from the 1886 ninth edition of Moses and Geology (Samuel Kinns, London). This book was originally published in 1882

Background imageSpectrum Collection: Rainbow

Rainbow. Image showing the supernumerary arcs under the main arc of a rainbow

Background imageSpectrum Collection: Interference pattern

Interference pattern. Light micrograph of interference patterns on a soap film. The different colours are due to interference of reflected light waves

Background imageSpectrum Collection: Rainbow in a darkened sky

Rainbow in a darkened sky

Background imageSpectrum Collection: Spectrum model

Spectrum model. Plastic model showing how all colours are made up of just red, green and blue, which are known as the primary colours

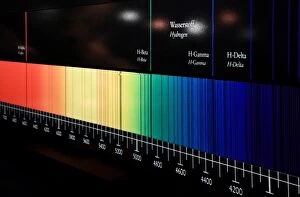
Background imageSpectrum Collection: Spectrum of visible light

Spectrum of visible light
Spectrum of white light, horizontal display. White light, such as sunlight, is composed of all the colors of light in the visible spectrum

Background imageSpectrum Collection: Candles under white light

Candles under white light. Image 2 of 2. The candles appear in their natural colours under white light. Colour is the result of an object reflecting and absorbing different parts of the visible


For sale as Licensed Images

Choose your image, Select your licence and Download the media

"Spectrum: Unveiling the Colors of Science, Art, and Nature" Step into a world where science meets art and nature reveals its true colors. The concept has fascinated humanity for centuries, unraveling secrets that span from the depths of space to the intricate patterns found in fractals. Let us embark on a captivating journey through time and knowledge. In 1954, the mass spectrometer emerged as a groundbreaking invention, enabling scientists to analyze matter with unprecedented precision. Its arrival marked a turning point in scientific research, unlocking new realms of understanding. Meanwhile, back in 1908, an ingenious paint chart was introduced - an innovative tool that revolutionized color selection for artists worldwide. This humble creation empowered painters to explore endless possibilities on their canvases. Speaking of colors, Robert Arthur Wilson's color wheel became an iconic symbol in artistic circles. With its harmonious arrangement of hues and shades, it provided guidance for countless creators seeking aesthetic perfection. But let us not forget about the stars above; they too have their own spectral tales to tell. Diagrams showcasing stellar classes and luminosity remind us how Sir Isaac Newton's pioneering work paved the way for our comprehension of light's behavior. Delving deeper into this realm is H-He-Hg emission spectra C017/7260 – a mesmerizing sight that captures elements emitting distinct wavelengths when energized. It serves as a testament to mankind's ability to decipher nature's language through scientific instruments. James Clerk Maxwell enters our narrative next – his caricature representing his significant contributions to electromagnetic theory. His profound insights laid the foundation for comprehending light as part of a larger electromagnetic spectrum. The spectroscope by Bunsen and Kirchhoff takes center stage next; dating back to around 1860 but published later in 1880 – it allowed scientists unparalleled glimpses into unseen worlds by analyzing light emitted or absorbed by various substances. Venturing beyond traditional boundaries brings us to the captivating Mandelbrot fractals.