
Spectrum Collection (#9)
"Spectrum: Unveiling the Colors of Science, Art, and Nature" Step into a world where science meets art and nature reveals its true colors


For sale as Licensed Images
Choose your image, Select your licence and Download the media
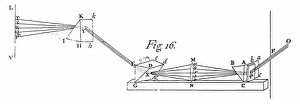
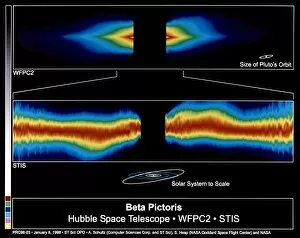
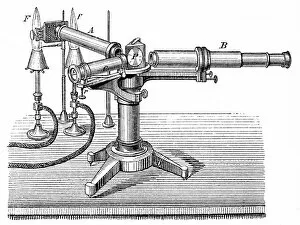
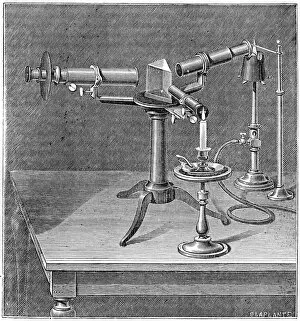
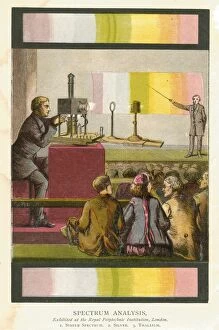
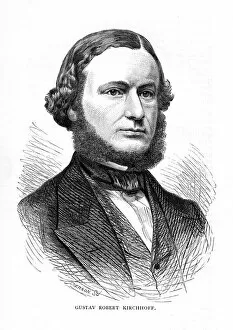
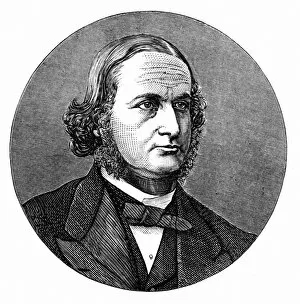
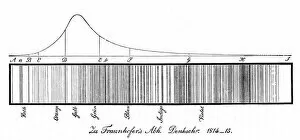
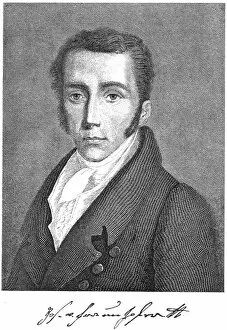
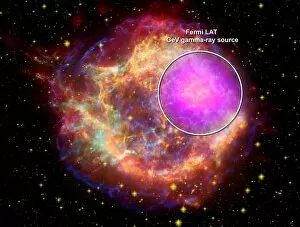
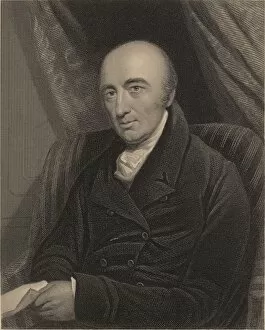
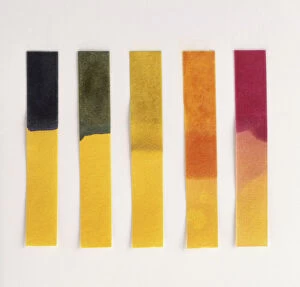
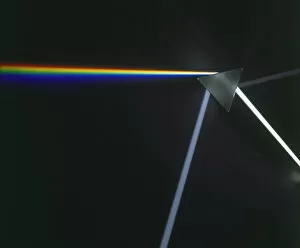
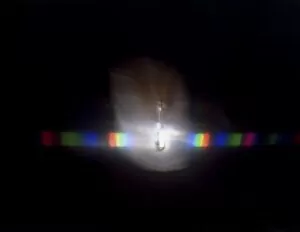
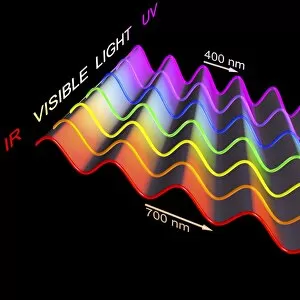
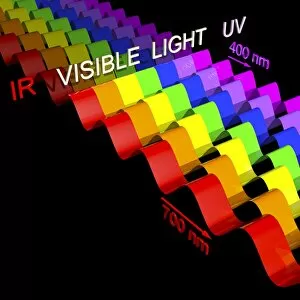
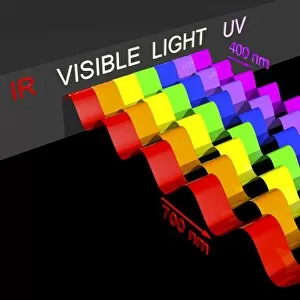
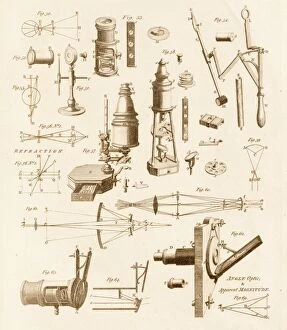
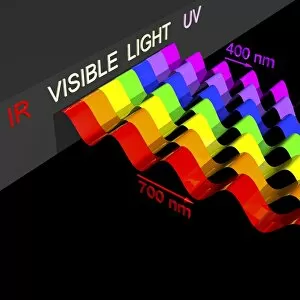
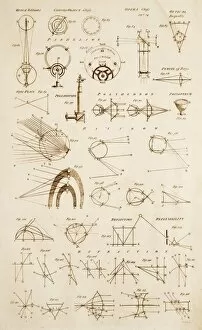
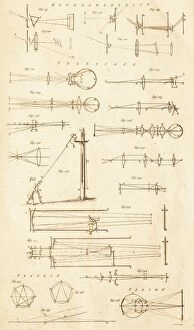
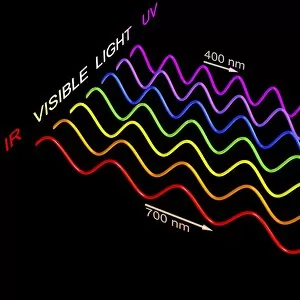
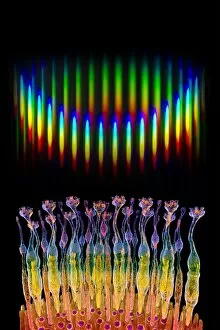
"Spectrum: Unveiling the Colors of Science, Art, and Nature" Step into a world where science meets art and nature reveals its true colors. The concept has fascinated humanity for centuries, unraveling secrets that span from the depths of space to the intricate patterns found in fractals. Let us embark on a captivating journey through time and knowledge. In 1954, the mass spectrometer emerged as a groundbreaking invention, enabling scientists to analyze matter with unprecedented precision. Its arrival marked a turning point in scientific research, unlocking new realms of understanding. Meanwhile, back in 1908, an ingenious paint chart was introduced - an innovative tool that revolutionized color selection for artists worldwide. This humble creation empowered painters to explore endless possibilities on their canvases. Speaking of colors, Robert Arthur Wilson's color wheel became an iconic symbol in artistic circles. With its harmonious arrangement of hues and shades, it provided guidance for countless creators seeking aesthetic perfection. But let us not forget about the stars above; they too have their own spectral tales to tell. Diagrams showcasing stellar classes and luminosity remind us how Sir Isaac Newton's pioneering work paved the way for our comprehension of light's behavior. Delving deeper into this realm is H-He-Hg emission spectra C017/7260 – a mesmerizing sight that captures elements emitting distinct wavelengths when energized. It serves as a testament to mankind's ability to decipher nature's language through scientific instruments. James Clerk Maxwell enters our narrative next – his caricature representing his significant contributions to electromagnetic theory. His profound insights laid the foundation for comprehending light as part of a larger electromagnetic spectrum. The spectroscope by Bunsen and Kirchhoff takes center stage next; dating back to around 1860 but published later in 1880 – it allowed scientists unparalleled glimpses into unseen worlds by analyzing light emitted or absorbed by various substances. Venturing beyond traditional boundaries brings us to the captivating Mandelbrot fractals.